old_but_not_dead_yet asked me about an interesting observation that the power-curve is more highly variable at short durations (eg 10s) than at longer durations (eg 10min) when it looks more concentrated.
He said, this reflected body energy systems, and unless I understood this, then I did not understand physiology and I needed to go back to school. Hmm….. strong.
![]()
I can see why he thinks this, if you look at power curve data it kind of looks like that…..

As it happens another athlete, Mike, asked me the same question in more useful way….
Looking at the power curve, is anaerobic power “more trainable” than aerobic power? If the power-duration curve tends to converge at long durations, then does this mean the curve shape (reflecting some aspect of long term fuel use) is relatively fixed? MIKE@dpcort
Today, I will dig into this, using the concept of power-curve dispersion.
Power Curve Dispersion
Take multiple plots of thousands of rider’s doing their best effort, across multiple durations, and you get this:

Now take their 50th percentile and their 90th percentile and their 10th percentile (percentile is where they rank relative to all others)……

We can also look at the hard data, in this table. If we plot the data as a percentage% of 50th percentile power, rather than raw power, for six time periods we get this:
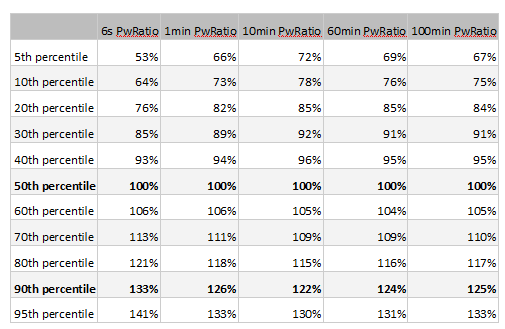
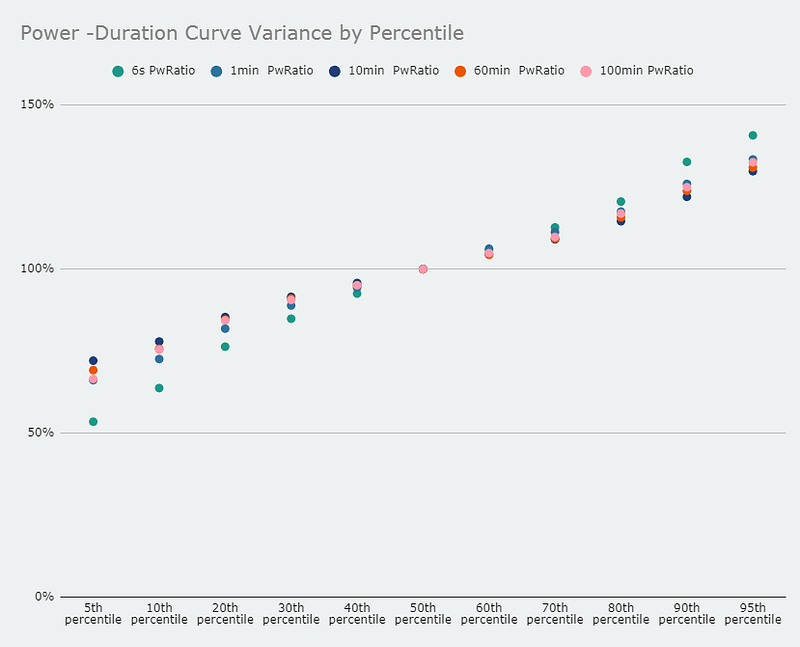
What this shows, is that relative to the 50th percentile, there is very similar dispersion in power curves from 6s, 60s, 600s, 3600s, and 6000s. True, there is a little additional dispersion effect *at 6s* and *above the 90th percentile* but the overall consistency in variance is strong. Certainly, it is not the case that everyone’s power converges at 10m or even at 100min. For example, a very strong rider on the 90th (close top) percentile would have 1.26x the 1min power and 1.25x the 100min power compared to an average rider. Plotted out in the graph it looks like this:

More Data
To go one step further, let’s plot the relative percentage as a proportion of 60min power (ie if all riders’ 60mins power was 1.0 what would be the variance compared with that?)

Interpretation
So the raw data shows that the power-curve is only a tiny bit more variable at short durations than at longer durations. What we are seeing is a kind of illusion which is in fact only a little bit more dispersion *x a higher raw number*. The actual % variance is remarkably similar.
This means all points on the power-duration curve are “flexible” compared with any other point. True, the closer two points, then the higher their inter-correlation.
Let’s look at this from a runner’s perspective.
old_but_not_dead_yet is asking if 100m sprint times are really varied but marathon times are really concentrated. But what I am saying is it’s like saying how close is your 400m run PR to your 600m run PR…..very close! How about your 400m PR vs your marathon PR? Hmm not so close.
What I am showing today, is that, looked at by percentiles, relative to the average (50th percentile) there is almost equal variation in sprint power (or time) as marathon power (or time). And what does this say about physiology?
It says both anaerobic power and aerobic power are equally trainable . In fact all energy systems are trainable. Probably equally trainable, but using somewhat different stimuli. Oh wait, you already knew that? Darn it! OK Someone tell old_but_not_dead_yet will you. 😉