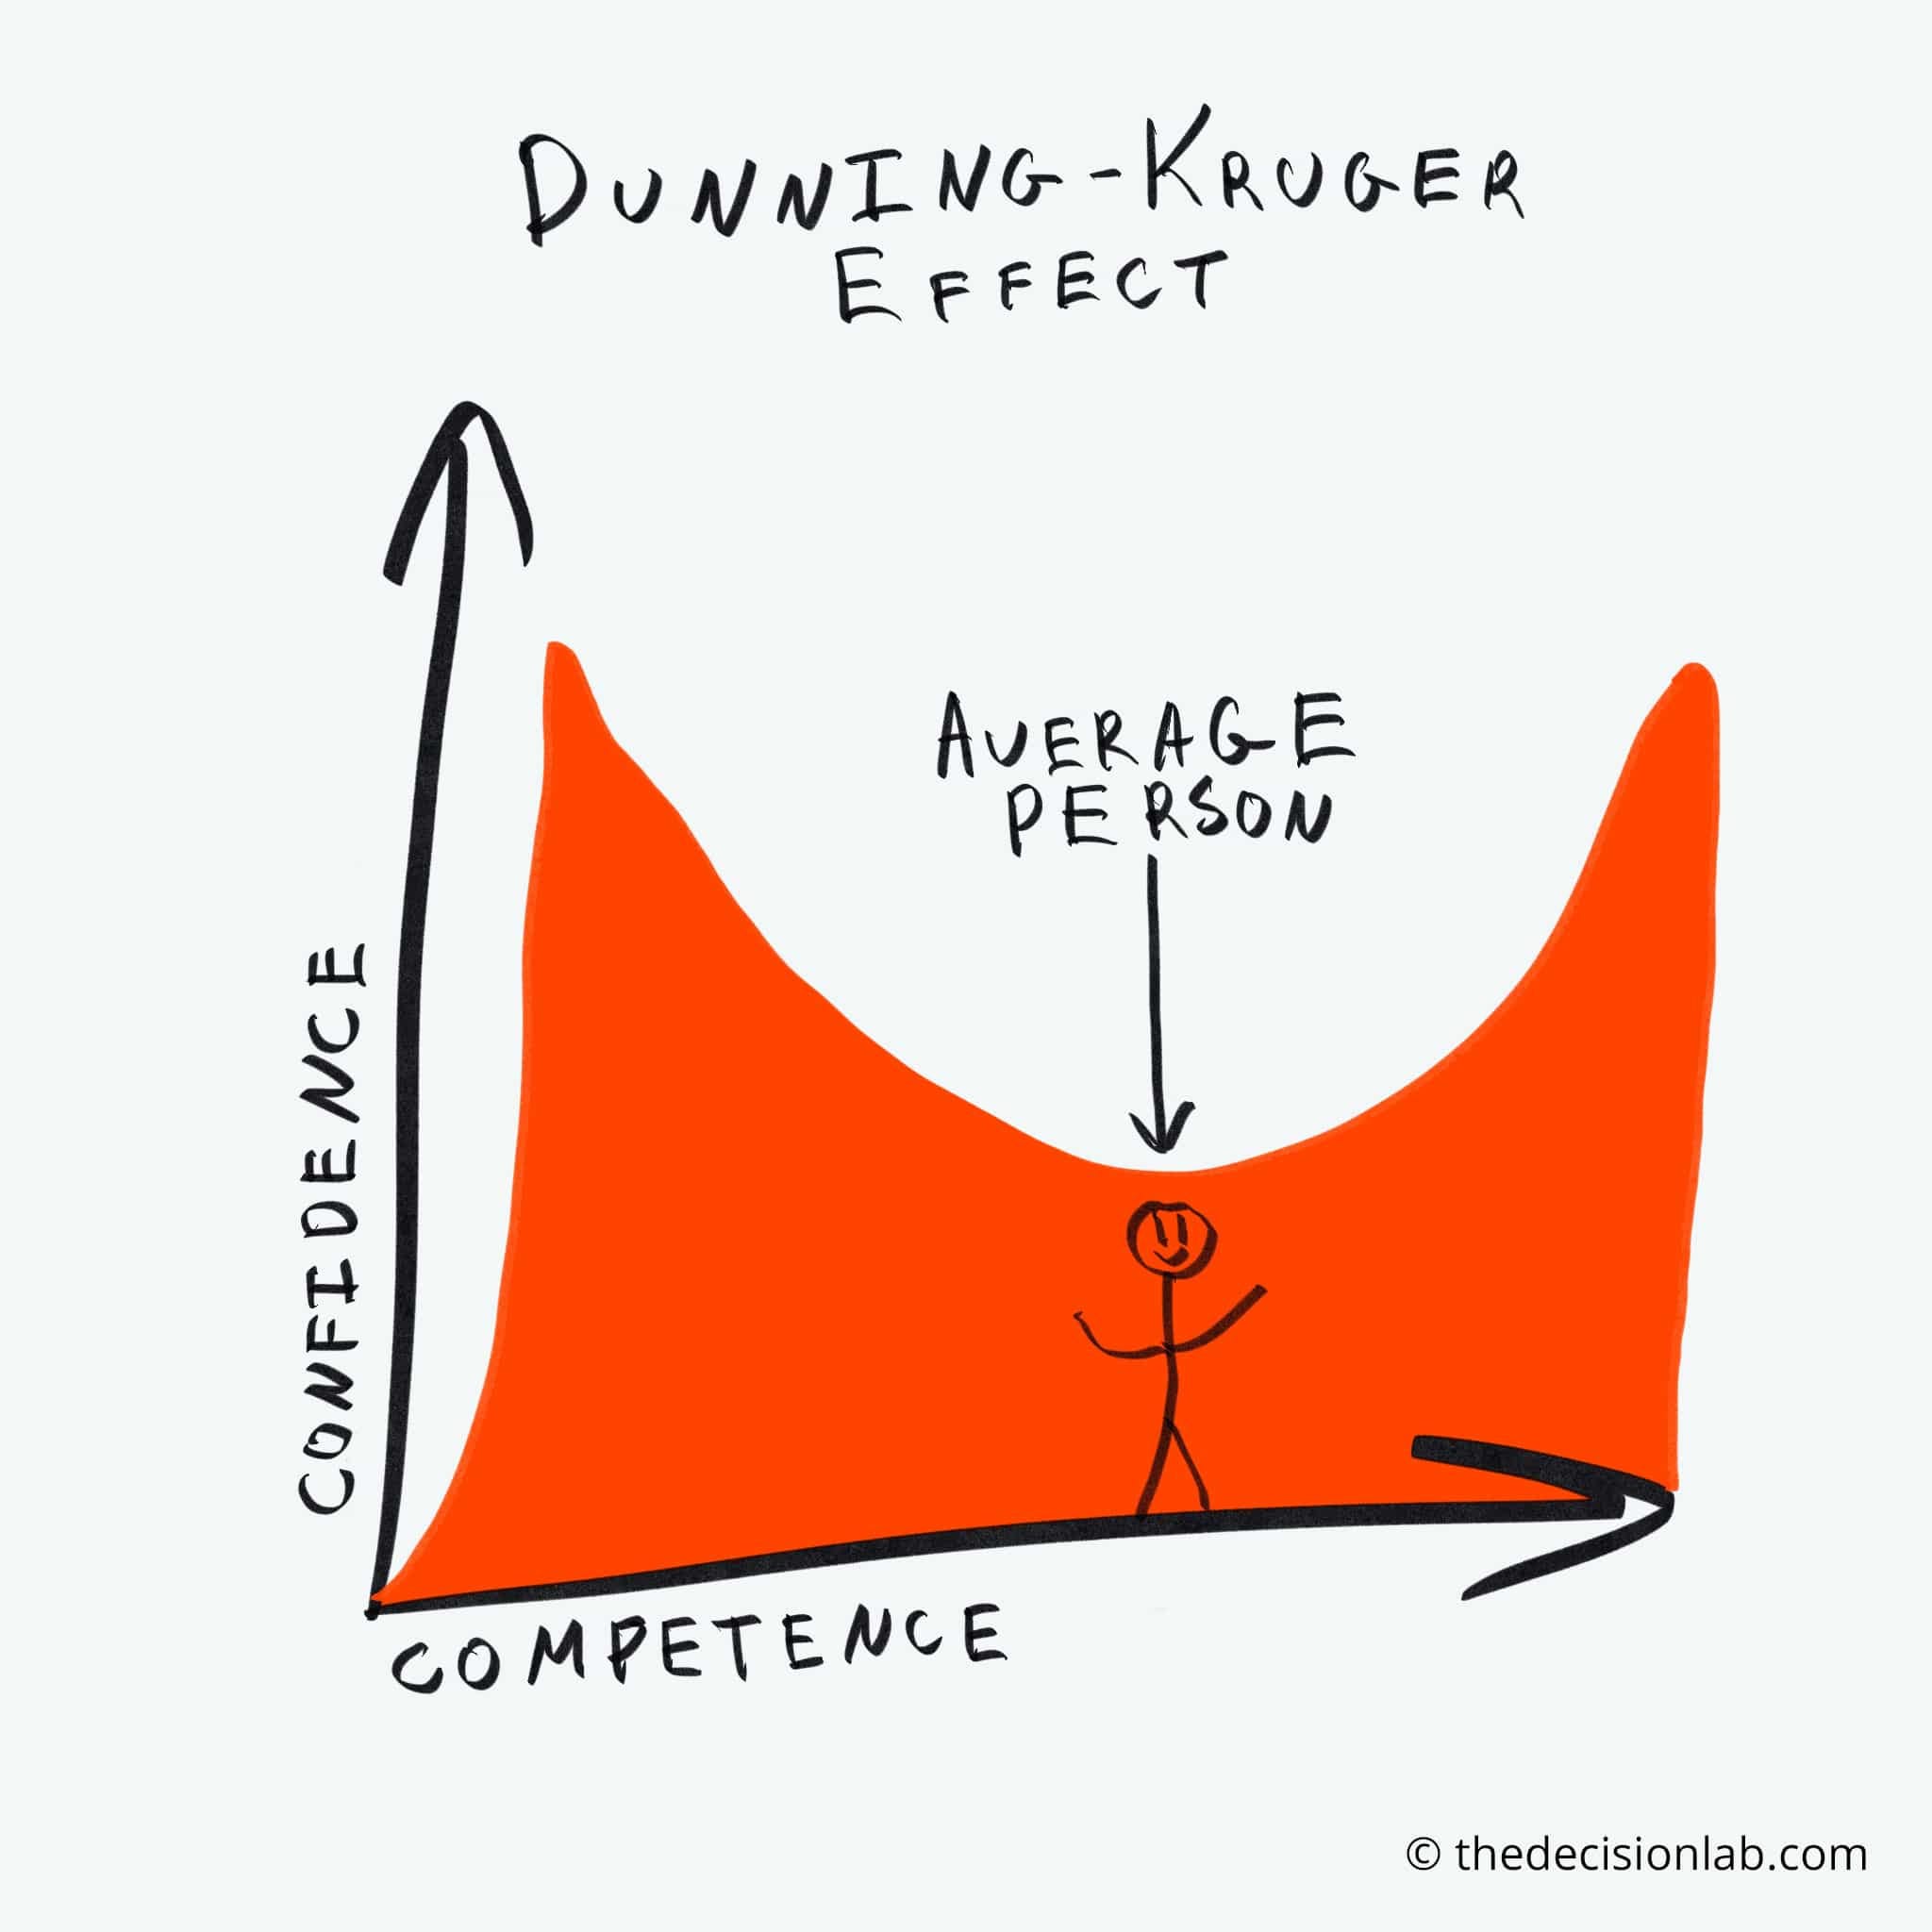
Have you heard of the Dunning-Kruger Effect? Basically when you have little knowledge you can overestimate your ability but the more you find out the more you realize you don’t know that much!
In cycling, when you start out, it feels like you might be getting strong, then you find out the readings of the pros and you don’t feel that smug anymore! This is closely related to the cognitive bias of illusory superiority…..94 percent of professors rated themselves above average relative to their peers, one third of programmers say they are in the top 5%, 85% of college students rated themselves above the median, 25% rating themselves in the top 1% and 80% of car drivers rated themselves “above average”. Hmm. Now in cycling we have lots of tools that actually measure something objective. Sure they are often not 100% accurate but they are a starting place. So all that said, are you prepared to answer the following question:
Considering your cycling ability as measured by power, how good are you on a scale of 1–100?
Pick an actual number, then read on. I am going to put my number at 41.
So what I am going to talk about today is how to find your actual metric, relative to others who also have a power meter. Wait what if you don’t have a power meter? Don’t worry, you can estimate your power from a climb against the clock using our forthcoming climbing calculator and a complex calculation which is an adaptation of the VAM (fft.tips/climb)
Lets make some excuses, that I am NOT talking about your ability to handle the bike, ride specific bikes, climb, draft, ride on the track, bmx, or MTB…in short this is not about skills, it’s actually a very narrow look at your power curve vs others. aka power profiling. BUT wait isn’t there a simple a long tried-and-tested way of simply testing your FTP?
Why FTP alone isn’t optimal
Yes you can test you FTP, but remember FTP is only 1x single time point….usually 60mins. And actually because most people cant face testing for 60mins, its often derived from 20mins or 8mins. Nothing inherently wrong (unless the FTP60 conversion formula aka 95% rule is in itself wrong) but there is a big limitation when you only test ONE time point. The reason is that if you try and predict a curve from one time point, then the curve will look similar no matter what type of rider.
Consider if a sprinter and an ultra-cyclist both have an FTP of 300w. Lets say they use the same FTP to plan sprint intervals at 150% FTP. Would those sprint intervals be appropriate for both riders? Unlikely. The ultra-cyclists find these very hard and the sprinter would find them relatively easy….not just they are used to doing sprints, I mean the zone would be too easy for their physiology in 90% of cases!! want proof?….read on…..FTP vs 4DP: The Staggering Difference in Accuracy ExplainedIn a sport where athletes obsess over precise tolerances for power meters and smart trainers, it hardly makes sense
How Inaccurate are Workouts based on FTP alone?
To their credit, sufferfest took 30,000* 4DP power profiles and analysed how much a rider’s actual 5min (MAP), 1min (AC) and 5sec (NM) power varied from the estimated values FTP-based apps typically use.
- 5 sec (NM) targets were inaccurate for 94% of athletes.
- 1min (AC) targets were inaccurate for 82% of athletes.
- 5 min(MAP) targets were inaccurate for 44% of athletes.
If you line up everyone’s (30,000 tests) results into an interactive graph for you to filter by age and gender where the y-axis (vertical) shows the percent of the sample that achieved that result. Some athletes can only manage NM efforts of 150% of FTP while others can hit 700% (Clearly showing the folly of having sprints set to 250% of FTP for everyone).

- You can also see three vertical lines, each representing where FTP-based apps typically set targets for MAP, AC and NM. This allows you to see where these assumptions sit within the full spread and it shows you why one fixed assumption is wrong, and also why basing everything on ONE time point (FTP) is very likely wrong, especially in sprint athletes.
What is Power Profiling?
Now if we extend our data capture beyond one time point we can move from FTP prediction to power profiling. This is the difference from a point on a curve and the actual power curve. Not just at one point in time, but across 4 or 5 or 6 key points. This is “power profiling” and will help you get your “cycling phenotype”. Eh? What’s that?
Cycling Phenotype
So how do you get your exact comparison with the pros? Well start by testing yourself with a power meter at various key times. This is the approach suggested by sufferfest in their 4DP but they only use 4 time points. Remember the more time points, the more accurate but the more hassle to collect all the data. For years we didnt have power meters and therefore we have ZERO points on the curve, then we had one point (FTP), now we have 4,5,6 or as many as you like!
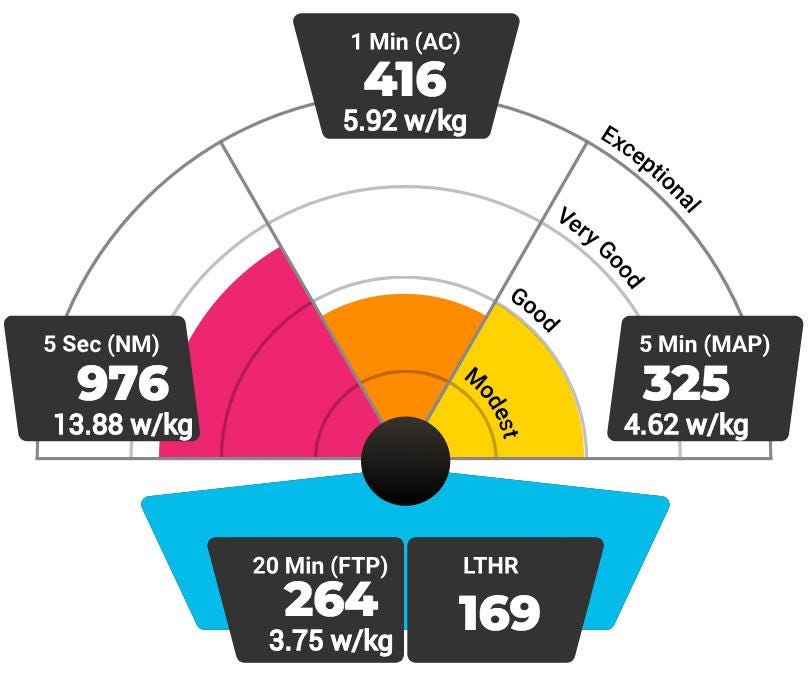
Sufferfest use maximum average power that you can generate for 5 seconds, 1 minute, and 5 minutes, 20mins and 60mins.
What emerges as you highlight your results will be a unique pattern that shows your relative strengths and weaknesses in cycling, which then help to define your specific phenotype. You may find that you are at a higher level in sprinting, for example, than in efforts requiring endurance. Power Profile might categorizes you as a time trialist. That doesnt mean you are stuck there, you can train your weaknesses and change your profile. The phenotype that best characterizes your riding currently.
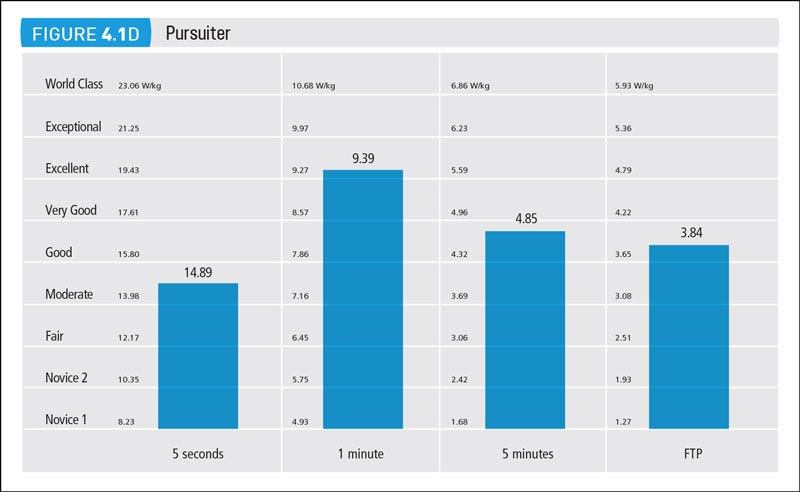
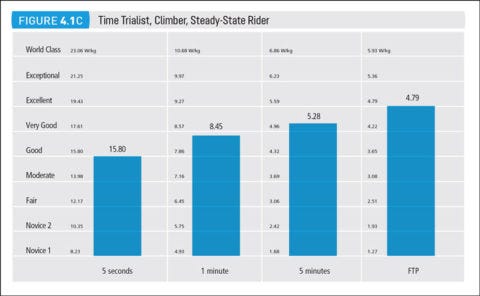
Here are some examples of power profiles, based on their relatively performance at 5 seconds, 1 minute, and 5 minutes and 20mins.
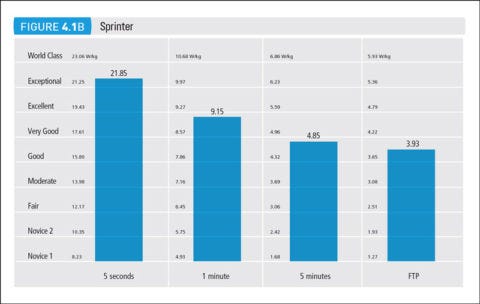
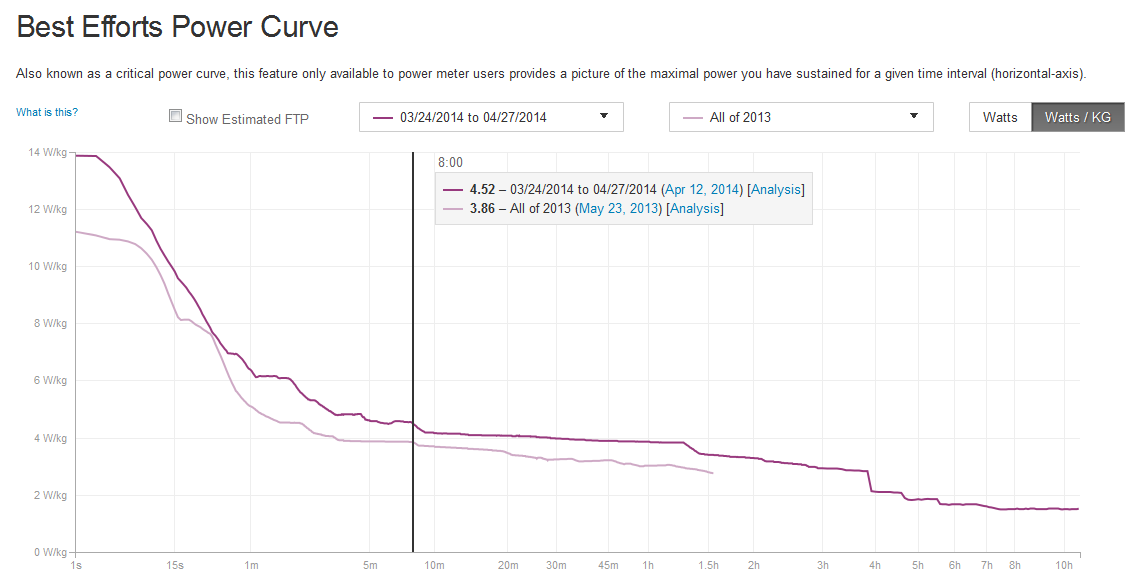
So how do you get these power profiles for free? Well first you have to have some data on your performance. Most people already have it in their strava profile, or intervals ICU profile. For example, go into strava and into power curve and read off your best effort for this year, or all time……
Next enter your data into our new tool which uses up to 6 time points up to a maximum of 12hours! Yes you can enter you PR at 12hours…..I don’t know about you but I have never ridden 12hrs without stopping!!
Personalized Power Profiling for free
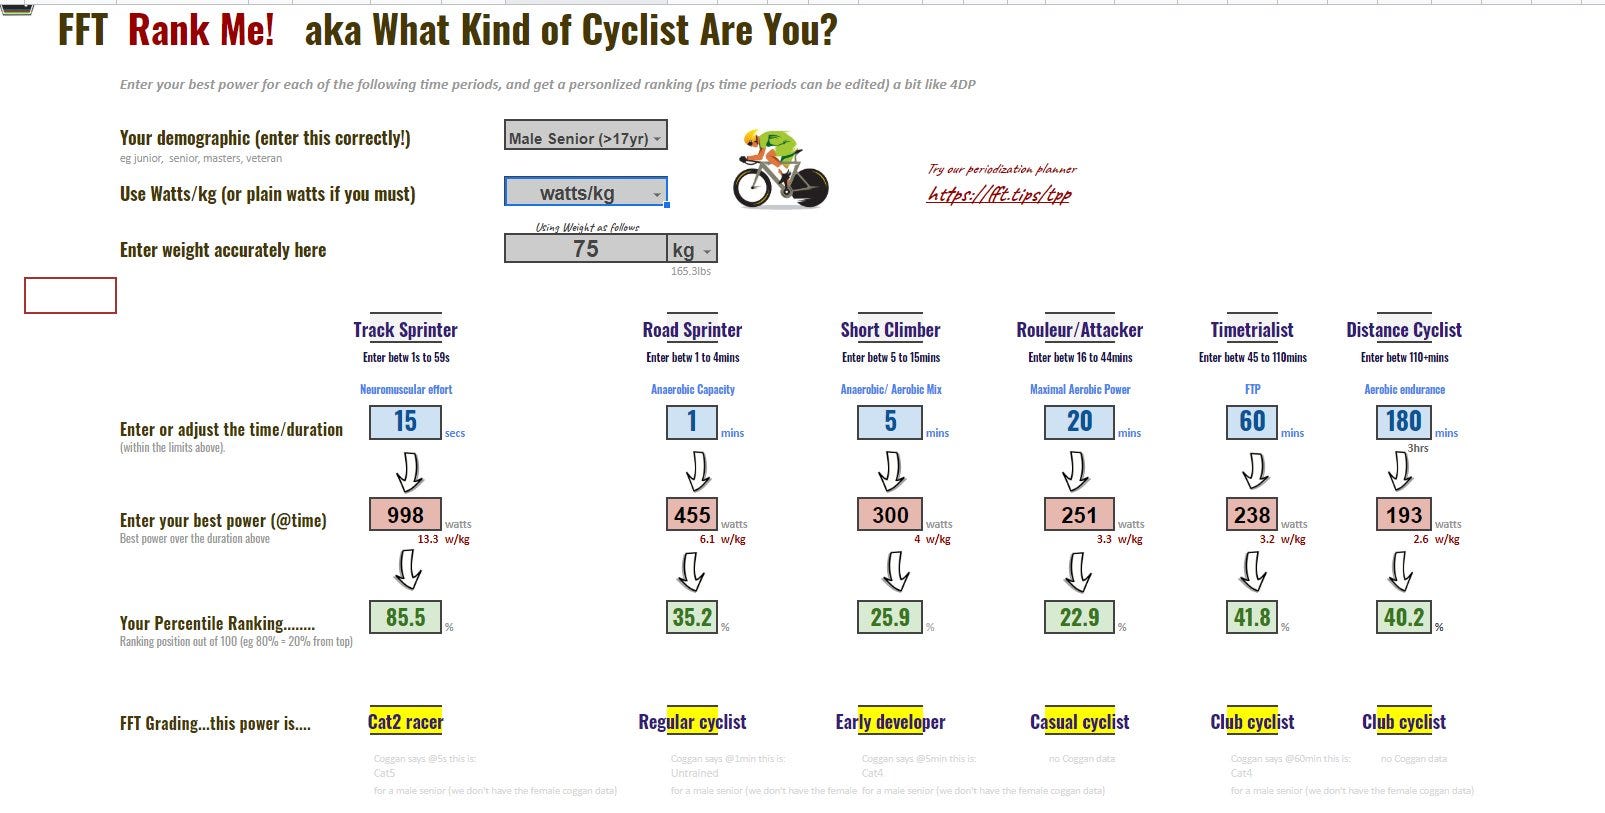
So you now need to enter your data. You can edit the time fields (blue cells) or keep them as they are. Look up on your strava curve your best effort (peak) at each of these times:
30s 1min 5min 20min 60min 2hrs and then enter the data…..now in the green cells you will get your percentile ranking. The percentile is where you would be in a line of the best to worst of 100 people lined up in order. In yellow you will get a description or badge of your ability.
But wait, we are not finished yet…..There’s more. A lot more!

We can look at the consistency of you ranking, and give you a score for smoothness. We can look at your power profile and categorise your “riding style” we can clarify your strongest and weakest area, and we can give a rough estimate of metabolic capacity. Finally we can combine each percentile to give an overall score. And speaking of overall score, what was my personal score. Remember I predicted 41, and I got…59! including a 4 for consistency. Well I guess I have an illusory inferiority bias instead of the superiority one!

Before I go, I quickly want to let you know you can improve in three simple steps. Step 1. review last year’s progress Step 2. make a plan for this year Step 3. Sign up to a training plan (fft.tips/peaks) or coaching programme.
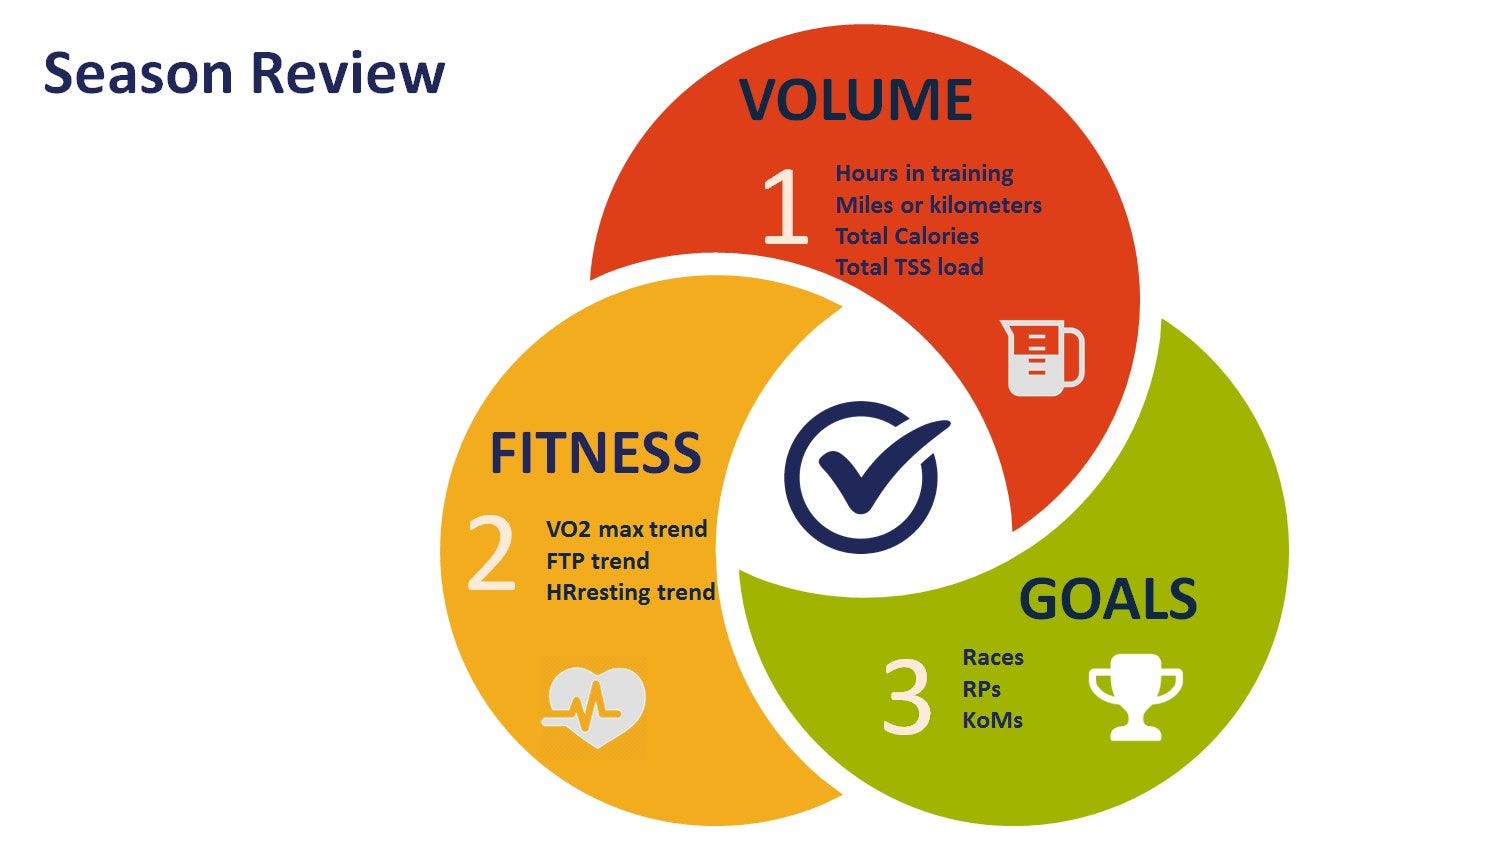
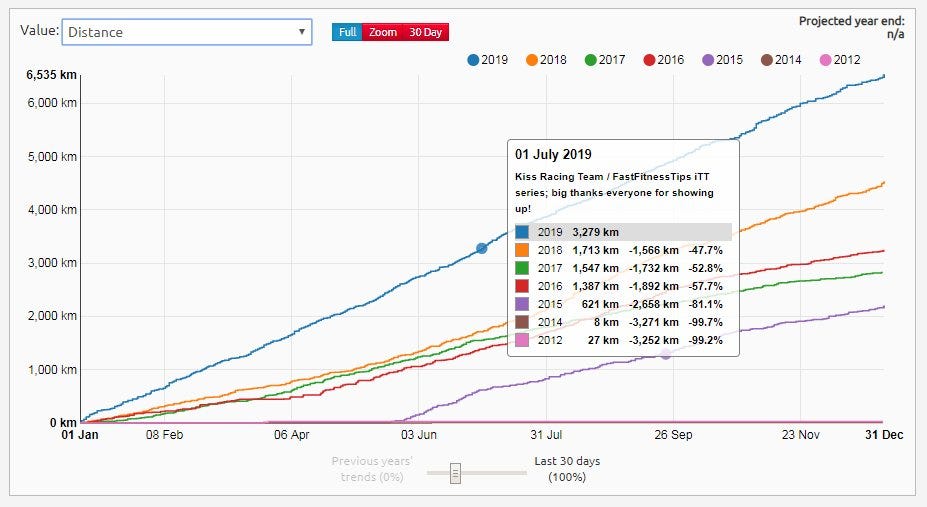
Step 1. Review What You Did Last Year
We just published a video (https://youtu.be/GtPYIHu1CKk)
on how to evaluate your progress against yourself. In short you can assess your volume (vs last year), your fitness (eg your FTP trend, your HRresting trend) or simply whether you achieved your goals. In addition you could look at how long you take on your favourite local course (solo, in similar conditions).
Great, you now know how you did last year and you probably found a lot of useful data on veloviewer.com
You can now use that information to plan for next year, specifically to set appropriate goals like this.
Step 2. Make a Plan
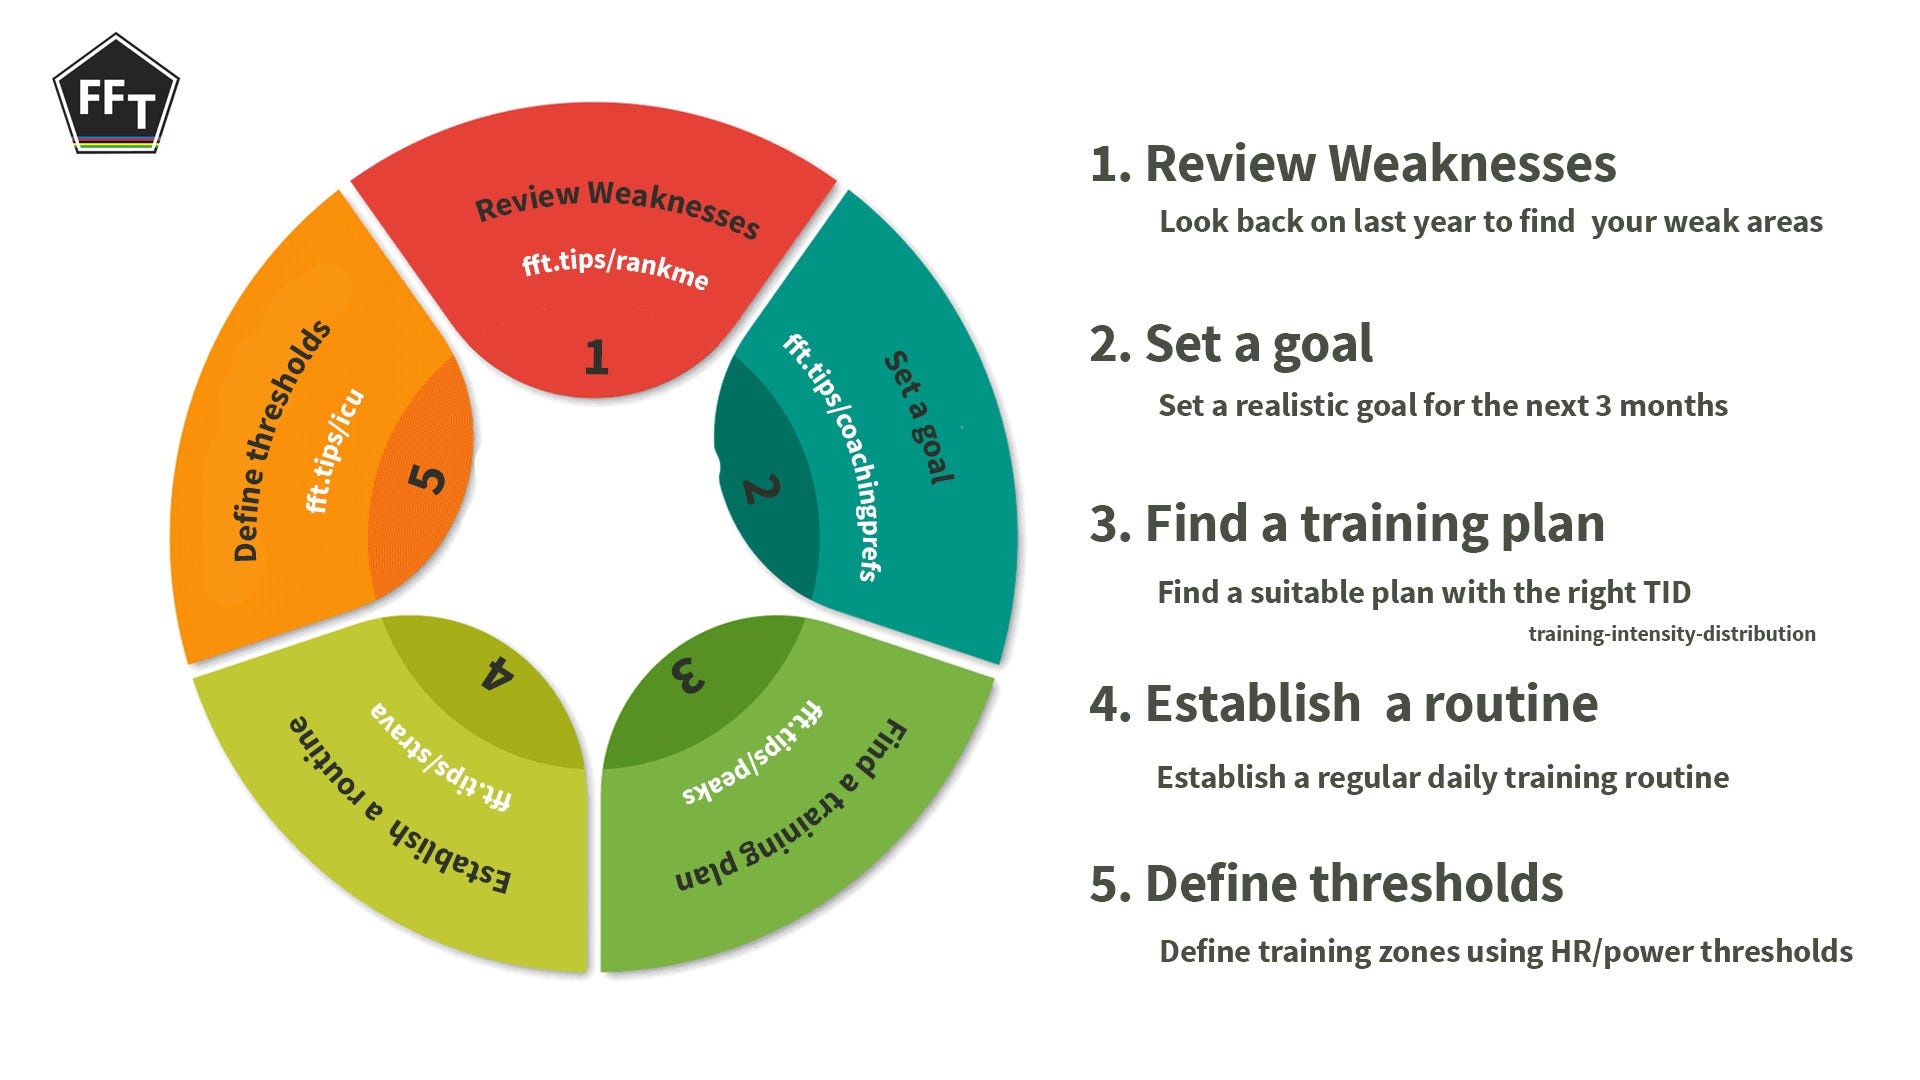
Step 3. Get Serious
Introduce structure using a training plan (fft.tips/peaks)or coaching programme (fft.tips/coachingflyer19)
That’s all for today!
Happy training! Alex from FFT